See which currency
is really moving.
Pipnotic charts each currency as its own index (EURX, USDX, JPYX…) next to the pairs, ranks currency strength from H1 to W1 and draws multi-timeframe trendlines for you. COT positioning, carry, buy and sell zones, replay and trading through cTrader are in the same workspace.
No card needed · The full platform for 3 days
Why Pipnotic
A pair only tells you half the story.
EUR/USD rising can mean a strong euro or a weak dollar. Pipnotic separates the two, and puts positioning and market structure next to the chart.
What you get
Everything you need to analyse, execute, and improve
An interactive charting and practice workspace with currency, positioning and insider data built in.
Interactive Charts
A fast HTML5 charting workspace — candles, Heikin-Ashi, OHLC, Renko and more — with automatic buy and sell zone detection, plus swings, liquidity, market structure and origin overlays. Drawing tools, click-to-set price alerts that email you when a wick crosses, and shareable live chart links.
Currency Indexes
Every major currency as its own chart — EURX, USDX, JPYX and the rest — built from the same pairs and bars as the strength ranking, on H1, H4, D1 and W1. Draw on them, set alerts and compare them with the pairs.
Multi-Timeframe Trendlines
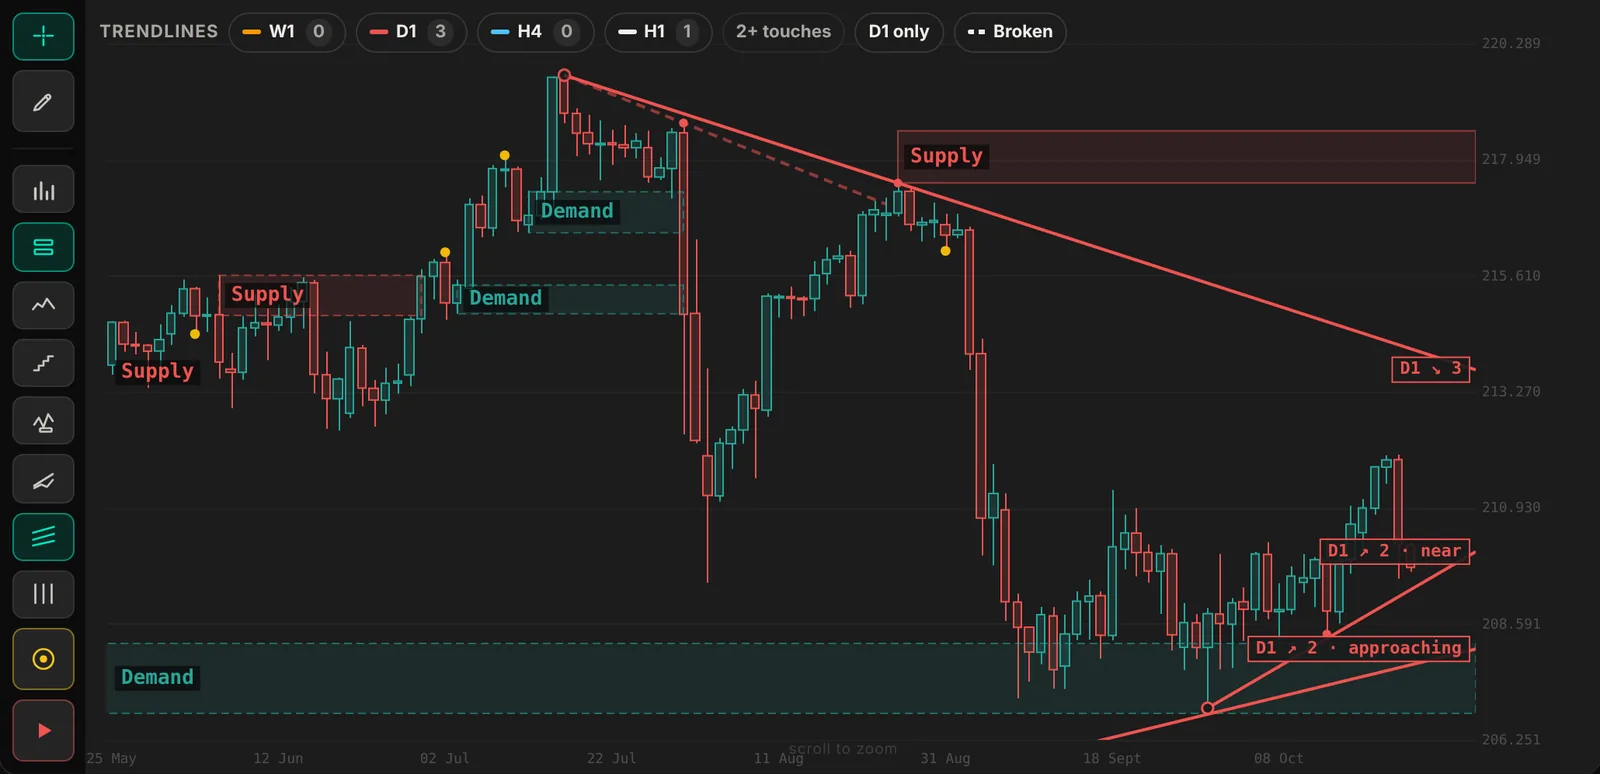
Rays drawn automatically from swing highs and lows on W1, D1, H4 and H1, colour-coded by timeframe and shown together on any chart. A line stays live only while no candle has crossed it; broken lines can be shown dashed.
Backtesting & Practice
Replay any market bar by bar with the future hidden and trade it in real time. Place market or limit orders with automatic, volatility-based stops and targets, then step or play through history. Every run is scored in R and saved to a practice journal — win rate, net R, expectancy, profit factor and max drawdown.
Buy/Sell Zone Alerts
Add pairs to a watchlist and get an email and in-app alert the moment a fresh buy or sell zone confirms — only once the confirming candle has closed, never on an open bar. Every alert links straight to the zone on the chart.
Live Edge Monitor
Real-time distance tracking for every active alert across all strategies and timeframes. COT alignment, data freshness, R:R, and progress toward target — all in one glanceable cockpit.
Currency Strength
Strength rankings for the 8 major currencies on H1, H4, D1 and W1: each currency's average move across all its pairs, with every reading placed against that currency's own history. Multi-Timeframe Consensus shows which pairs line up on all four timeframes.
Regime Detection
Per-symbol market classification using ADX, EMA crossover, and the Hurst exponent. Trending, ranging, breakout, or weak trend — with an Alert Alignment table that scores every active alert against current regime and currency strength.
Algorithmic Alerts
Rule-based strategies that publish entry, stop and target, with COT confluence scoring. Every alert's live outcome is recorded, so each strategy's track record is there to check.
COT Analysis
CFTC Commitments of Traders data for 28+ futures markets updated weekly. COT Index, speculator net positioning, commercial hedger activity, and momentum classification.
Insider Intelligence
SEC Form 4 filings parsed daily. Cluster alert detection fires when 3+ insiders buy the same company within 30 days. Open-market purchases and sales only; grants and option exercises are excluded.
Carry
Interest-rate differentials for every pair from FRED data, and your own broker's swap rates when cTrader is connected.
Trade from the Chart
Connect cTrader to place and manage trades on the chart, with the position size worked out from your risk and your stop.
Education & EAs
Structured curriculum covering every platform module, strategy mechanics, and trade psychology. Includes BASZ and ASR Expert Advisors for MetaTrader 4 automated execution.
Trade Simulator
Monte Carlo simulation of your strategy across thousands of scenarios. Model win rate, risk/reward, drawdown, and ruin probability before putting real capital at risk.
FreeThe alert engine
The alert strategies
Each strategy publishes entry, stop and target when its rules are met, and every alert's live outcome is recorded. Past results don't predict future ones.
Mean reversion to MA, only in MA-slope direction, robust σ (MAD) deviation entries with fixed R targets
Trend-continuation signals at asset-strength breakout zones
Fades Daily/Weekly liquidity sweeps on the antipodean range crosses (NZD/CAD, AUD/NZD).
Limit-retrace into S/D / BSZ after a pos/neg expansion.
Currency strength
Know which currency is moving — and why.
Each currency is measured against all of its pairs at once. When EUR ranks first and JPY last, EUR/JPY is where the strongest meets the weakest.
How it works
How members use it
Read the currencies
Start with the currency indexes and the strength ranking to see which currencies lead and which lag, then check COT positioning and the market regime.
Mark the levels
Open the pair on the chart: automatic trendlines on four timeframes, buy and sell zones and price alerts show the levels you are watching.
Plan and practise
Size the trade from your risk and stop and place it through cTrader, or rehearse it first in bar-by-bar replay and paper trading.
Live data preview
What insiders are buying right now
Real SEC Form 4 open-market purchases filed this week. Members see the full feed with cluster detection, insider profiles, and watchlists.
IAM
$11.5M
16 Oct
NONE
$9.6M
17 Sep
CRBG
$6.8M
20 Oct
DOLE
$5.8M
21 Oct
REF
$3.0M
31 Jul
BPRE
$2.4M
07 Oct
Testimonials
Traders who changed their game
"The Pipnotic software has been an invaluable addition to my trading approach. The clearly defined supply and demand levels help me refine my entries and minimize my risk substantially. Combined with Sarid's excellent educational resources, accessibility through the forum and his commitment to the weekly symposiums, this is an exceptional trading tool!"
"I have been using the Pipnotic Software for the last two years. It is amazing how Sarid has improved the Pipnotic software over that timeframe. Sarid is very giving of his time and teaching to support all levels of traders. I find the weekly symposium is very educational. I highly recommend this software and the Pipnotic service."
"I've been learning Forex since 2004. But, since September of this year when I first started actually studying Supply and Demand with the help of Pipnotic. Well, OMG. Get your head out of your ass if you are serious and sign up."
Pricing
Plans
Every new account starts with a 3-day free trial of the full platform. No card needed. No hidden fees. Cancel anytime.
- Actionable Daily alerts — forex, crypto, commodities, indices & stocks
- Entry, stop & target on every alert
- Currency Strength — best swap timing
- In-app messages from the team
- One clean screen — light or dark, mobile-friendly
- Interactive charting & backtesting
- All strategies, COT, insider & regime
- Expert Advisors, Pine Scripts & education
Cancel anytime · Instant access
- The full platform
- Currency indexes & automatic trendlines
- All strategy alerts
- Currency Strength + What to Trade
- Multi-Timeframe Consensus
- COT analysis — 28+ markets
- US insider filings (SEC Form 4)
- Live Edge Monitor & Regime Detection
- BASZ & ASR Expert Advisors (MT4)
- TradingView Pine Scripts
- Full education library
- Alert emails
- Community Chat
No card needed · Cancel anytime
Billed €828/year · Save €240 vs monthly
- Everything in Monthly
- Priority support
- Early access to new modules
- Alert emails
- Community Chat
- Locked-in price guarantee
- ~2.7 months free vs monthly
FAQ
Common questions
Yes. Every new account gets the full platform free for 3 days, with no card needed. After that, choose a plan to keep full access.
Currency Strength measures how each major currency is performing across all its pairs at once. For each currency, Pipnotic averages the percentage moves of every tracked pair that contains it over a lookback — 24 bars on H1, 40 on H4, 60 on D1 and 26 on W1 — counting a move as positive when the currency is the base and negative when it is the quote. The currencies are ranked, and each reading is placed as a percentile against that currency's own history, so an extreme reading means unusual for that currency.
A currency index is one price series for one currency. Pipnotic builds it from the same pairs and bars as the strength ranking: 100 × the exponential of the average log price across the currency's pairs, inverted where the currency is the quote. You can chart, draw on and set alerts on EURX, USDX, JPYX and the other indexes like any pair.
Falling lines are built from swing highs and rising lines from swing lows on W1, D1, H4 and H1. A swing within 0.25 ATR of a line counts as a touch. A line is shown as a ray to the right edge only while no candle has crossed it; broken lines can be shown dashed, ending at the break.
The Commitment of Traders report is published every Friday by the CFTC and shows how commercial hedgers, large speculators, and retail traders are positioned in futures markets. Commercials — hedgers with real underlying exposure — are often positioned against the crowd at turning points. The COT Index places current net positioning within its range over the last 3 years, so readings near 0 or 100 mean positioning is at an extreme.
Regime Detection combines ADX trend strength, the Hurst exponent (trend vs mean-reversion classification), ATR expansion, and EMA slope to classify each market as Trending Up, Trending Down, Ranging, Breakout, or Weak Trend. The Alert Alignment table shows every active alert enriched with its regime, Hurst value, currency strength differential, and a Conviction score — High, Medium, or Low — so you can instantly see which alerts have full structural support.
A cluster alert fires when 3 or more corporate insiders make open-market purchases in the same company within a 30-day window. We track US SEC Form 4 filings, filtering to open-market purchases only — not grants or option exercises.
Forex alerts cover major and minor pairs across H1, H4, D1, and W1 timeframes. COT data covers 28+ futures markets including currencies, equity indices, bonds, metals, and energy. Insider intelligence covers all US-listed stocks. Currency Strength covers all 8 major currencies across all four timeframes.
Yes. BASZ and ASR Expert Advisors for MetaTrader 4 are included in the premium plan. The web platform — alerts, currency strength, COT, insider, and all dashboards — works in any modern browser with no install required.
Alerts are scanned continuously and updated when new price data arrives. Currency strength is recalculated after every price update. COT data updates every Friday after the CFTC releases the report at 3:30pm EST. Insider filings are imported daily from SEC EDGAR.
When a new active alert is created by the scanning engine, premium members with alerts enabled receive an email immediately. The email shows the symbol, direction, strategy, timeframe, and current edge health status. Entry prices, stop levels, and targets are not included in alerts — log in to the platform to view full alert details. You can turn alerts on or off at any time from your Account page.
Community Chat is a live broadcast room for premium members. All connected members see messages in real time. You can @mention other members, react with emojis, and see a live feed of who is online. The chat also displays a transparent trade performance feed showing recent closed trades from strategies with healthy edge status — published automatically with a one-hour delay.
Ready?
See the whole board.
Currency indexes, currency strength, automatic trendlines, COT positioning and insider filings in one workspace — try all of it free for 3 days.
No card needed · The full platform for 3 days